

Children can collect a great deal of scientific information without necessarily knowing how to organise it. Recording data is therefore an important part of learning how scientists turn observations and measurements into usable evidence.
The progression in this skill goes further than graphs getting harder. Children become increasingly able to choose and use a suitable way of showing their evidence, so that the answer to their question can be seen.
What the National Curriculum says
In Years 1 and 2, children should be "gathering and recording data to help in answering questions". In Years 3 and 4, they should be "gathering, recording, classifying and presenting data in a variety of ways to help in answering questions" and "recording findings using simple scientific language, drawings, labelled diagrams, keys, bar charts, and tables". In Years 5 and 6, they should be "recording data and results of increasing complexity using scientific diagrams and labels, classification keys, tables, scatter graphs, bar and line graphs".
Key Stage 1: records that show what was seen
In Year 1, recording might be very simple. Children could draw the leaves found on a walk or keep a tally of the birds seen in the playground. What matters is that the drawing or tally shows exactly what they saw. "I saw five pigeons. That's four lines and one across."
By Year 2, children record results in a table or block graph and use it to answer a question. Filling in a prepared table of plant heights, they read off which plant grew the most: "The table shows the sunflower grew the most." The important development is that the record is now being used. A child who points to their table to answer the question understands why they recorded the data in the first place.
Lower Key Stage 2: taking ownership of the record
In Year 3, children add their own headings to a results table. Heading up a table with the surface tested and the distance the car travelled in centimetres, they put the unit in the heading and each result in the right column: "I put 'cm' at the top, so I don't have to write it every time." This is a small step that shows a big change. The child is organising the evidence themselves.
By Year 4, children decide how to record their results, in a table or a bar chart. They might choose a bar chart to show how warm each cup stayed, or a labelled diagram for a circuit, and explain why their way of recording suits the results: "I did a bar chart because it's easy to see which cup was warmest."
Upper Key Stage 2: choosing the right representation
In Year 5, children draw a line graph when their data changes over time. Plotting the temperature of cooling water every minute and joining the points, they label both axes with units and plot each point accurately. The graph now shows something a table cannot: "The line goes down fast at the start, then it slows down."
By Year 6, children choose the best graph for their data, including scatter graphs. They might choose a scatter graph for height against arm span and a bar chart for heart rate after different exercises, and explain why each suits the data: "I used a scatter graph to see if taller people have longer arms."
The progression runs from recording what happened, to organising evidence, to choosing an appropriate representation, to presenting increasingly complex data so that relationships can be seen.
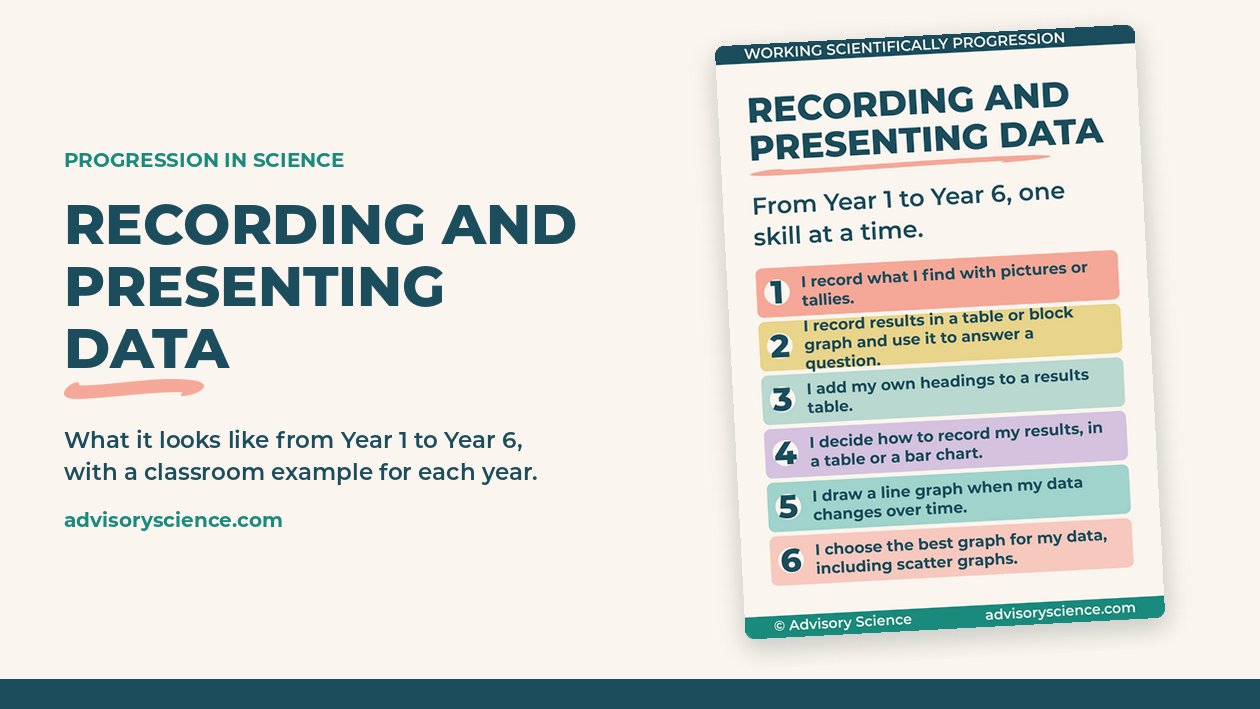
The progression on one display
- Year 1: I record what I find with pictures or tallies.
- Year 2: I record results in a table or block graph and use it to answer a question.
- Year 3: I add my own headings to a results table.
- Year 4: I decide how to record my results, in a table or a bar chart.
- Year 5: I draw a line graph when my data changes over time.
- Year 6: I choose the best graph for my data, including scatter graphs.
A useful subject leader check
Look at the results tables and graphs in books from each year group. Ask: who drew the table, and who chose the graph?
If every table arrives pre-printed and every graph type is chosen by the teacher, children may be filling in records without learning to organise evidence. By Year 6, a child should be able to look at their data and decide how best to show it.
The final article looks at drawing conclusions and evaluating.
Free display: Recording and Presenting Data from Year 1 to Year 6, one A3 panel per year group plus a one-page summary, ready to print. Download it free.
Teach it with your class: the Working Scientifically Skills Pack gives you a slide for each of the six skills, with a model answer after each one, for KS1 and KS2. See the skills pack